Since its initial release back in December, GTMetaExp has had a few cosmetic changes. Its main form is now resizable to take advantage of larger screens, a Feature Filter was added to the Features and Components tab to make it easier to locate a feature, and column sort capabilities were added to every List View in the application. Ownership Relationship information was added to the Features and Components tab, and a handful of fixes and other tweaks were made also along the way.
This posting is concerned with the new functionality and most of it is located on the Find Feature tab. This new tab does exactly what its name implies; it will find a feature in the GIS database. Technically, this new functionality is moving beyond pure metadata exploring and into data exploring, but since finding a feature in the GIS Database is heavily dependent on the metadata, we haven’t felt it necessary to change the name of the product. Since the initial version, GTMetaExp has been able to produce a Style and Label Rule Usage Report which is also data dependent and not purely exploring the metadata, so the new functionality is not that far removed from our initial intent of the product.
Find Feature
The Find Feature tab will let you find a specific feature in the GIS data with 3 different query methods: Find by Attribute Value, Find by G3E_FID, and Find by Predefined Query.
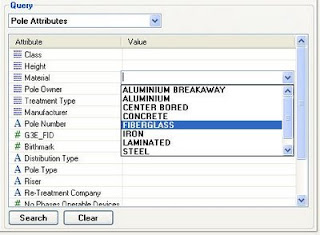
Find By Attribute Value is probably the most flexible of the three methods and possibly the most useful. This query method allows you to select a Feature Type that you want to query (from the Features list), then it will present a list of all tabular components associated with that feature. The Primary Tabular Component is selected by default, but you can select any of the available components from the component dropdown list. With a Component selected, the Attribute/Value List View is populated with all available Attributes associated with the feature’s selected component.

You can select any attribute in the list and provide a value. When the Search button is pressed, the feature’s component table is searched for all records that match the value provided. If more than one attribute value is provided, the criteria are ANDed together. The records are also filtered by the feature’s number (G3E_FNO) so that only records belonging to the selected feature will be returned (in case you are searching a shared table like Common or Connectivity).
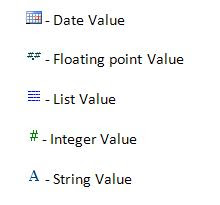
The icons to the left of the Attribute name tell the kind of value is expected for the attribute:

While you can always enter a value, special types like Dates and Lists will have a drop down to assist in entering their value. A Date Type will use a Date Picker and a List will use a ComboBox containing all of the values of the attribute’s associated Pick List.

When the Search button is pressed, all records matching the search criteria are shown in the Results List View.
Find by G3E_FID is a specialty query method. When you only have a G3E_FID, this query will search all feature tables until a feature is found with the specified G3E_FID value. Enter a G3E_FID in the prompt and press the Search button to perform the query. The Common and Connectivity tables are searched first since they will likely contain the feature; however, if the feature is not found, all feature tables will be searched.
The Find Feature Results List View is populated when the Search button is pressed on one of the query tabs. The results can be sorted on any column by clicking the column header. The results can also be copied to the Windows Clipboard.
If you select a record in the results, you have three options to choose from: Attribute Info, Connectivity Search, and Ownership Search.
Attribute Info
The Attribute Info option (also activated by double-clicking on a result record) will display all of the available tabular attribute information for the selected feature. The attribute information is displayed in a GTViewer-style Attribute Info form where each tab is one of the feature’s components.
By default, the Attribute Info is shown using the Component and Attribute User Names as they are defined in the metadata. However, the radio buttons across the top of the form can be used to change the display names to their actual database names or a combination of the user name and database names.

You can show several Attribute Info forms at the same time so that a comparison can be made between different features. The Copy button is also available to copy the active tab’s contents to the Windows clipboard.
Connectivity Search
The Connectivity Search feature will visually show all features connected to the selected feature in the Query Results. The selected feature and its immediate neighbors are then represented in a simplified graph view. The Connectivity Search is intended to help identify problems in the connectivity by quickly visualizing how the connections are represented in the database.
The Connectivity Search can visualize the data in two different ways: Features as Links and Features as Nodes. The visualization method is selected in the lower left corner of the Connectivity Search form and defaults to Features as Links method.
The Features as Links method is useful for identifying problems in connectivity records because it represents the connectivity information exactly as it appears in the database, only in a visual format. Connectivity Nodes are shown as pink circles while features are shown between the nodes as blue ellipses (linear features) and orange ellipses (point features).

The Features as Nodes visualization method represent only the features as nodes in the graph (blue for linear features and orange for point features) with connectivity records shown as the links between the features. This approach uses fewer nodes in the graphic, but the number of links can be greater as trace steps are added. This view of the data may often be useful when examining connectivity problems as it shows a more real-world view of the data versus the connectivity table representation.
Both Connectivity Search Visualization Methods support the Trace Next Step button which will find all features connecting to the features currently in the view. Trace Next Step can be used as long as there are more connecting features. While the graph may quickly become very busy, tools are provided to help manage the view. The Zoom In and Zoom Out buttons will control the current view scale and scroll bars along the view’s bottom and right provide panning capabilities. The Fit All button will fit the entire graph in the view, and the Reset Trace button will return to the initial feature and its immediate neighbors. The Print button will allow the graph to be printed.
Hovering the mouse cursor over any node in the graph will display Tooltip information about a node including the feature’s connecting Node values, Fid, FNo, CNo, Cid, and Id.
Pressing the Right Mouse Button on a node will give two options: 1) Restart the trace from this Node or 2) Show Attribute Information for feature associated with this Node.
Ownership Search
The Ownership Search will visualize the selected feature in the Query Results and all features sourced to or owned by the selected feature. The Ownership Search will iterate through the features until no new features can be found.
In the Ownership Search results below, the starting feature is always shown in Orange while all of the other features are shown in Blue. The connecting links point to the owner. In the example below, the OH Transformer is the starting feature and is owned by the Pole. The Pole also owns three Secondary Conductors and a Down Guy.
A more complex example is shown below:
The Ownership Search form provides view control with the Zoom In, Zoom Out and Fit All buttons. Panning can be performed with the scroll bars along the bottom and right of the graph view. Like the Connectivity Search, Tooltips will also be shown for each node in the graph and a Right-Mouse Click on a now will provide the option to display Attribute Info for the associated feature.
Summary
The new capabilities added to GTMetaExp broadens its potential user base. A variety of uses can be found for the Find Feature functionality which extends beyond ability to explore the metadata. GTMetaExp will continue to be in beta until the end of the year, and a beta version will be provided upon request (support@gti-us.com).


